BlogPost
The debate is in full swing about how to rank online schools so the public, and particularly students, can more effectively evaluate different programs. Part of that discussion is who and what are students studying.
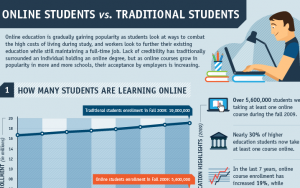
So, we worked with the folks over at Online PhD Programs to produce this infographic to help give a visual overview of the current profile of online students— what they’re studying and how they are perceived.
A big issue in online education is retention rates. We think this simple graphic of some major players shows the differences across the board. We were interested to see Capella at the bottom of these schools with a 20% retention rate— especially given the intense loyalty expressed against our position piece about Capella’s decision to abstain from U.S. News ranking.
But enough words, on with the show

Via: Online PhD Programs Blog

Comments